


Smart AI Funnel Chart Generator Using Tableau & CSV
In the modern digital landscape, data is often compared to oil it is incredibly valuable, but only if it is refined.
For businesses striving to grow, the most critical “refining” process happens within the sales and marketing funnel. Understanding how a lead transforms into a loyal customer is the heartbeat of growth.
However, manually tracking these transitions can be an overwhelming task. This is where a Smart AI funnel chart generator using Tableau and CSV document becomes an indispensable asset.
By leveraging Artificial Intelligence, Machine Learning, and the robust Business Intelligence capabilities of Tableau, companies can move beyond static spreadsheets.
They can create dynamic, automated funnel charts that not only show what happened in the past but also predict what will happen in the future.
This article explores how to integrate these technologies to build a human-centered, high-performing visualization system
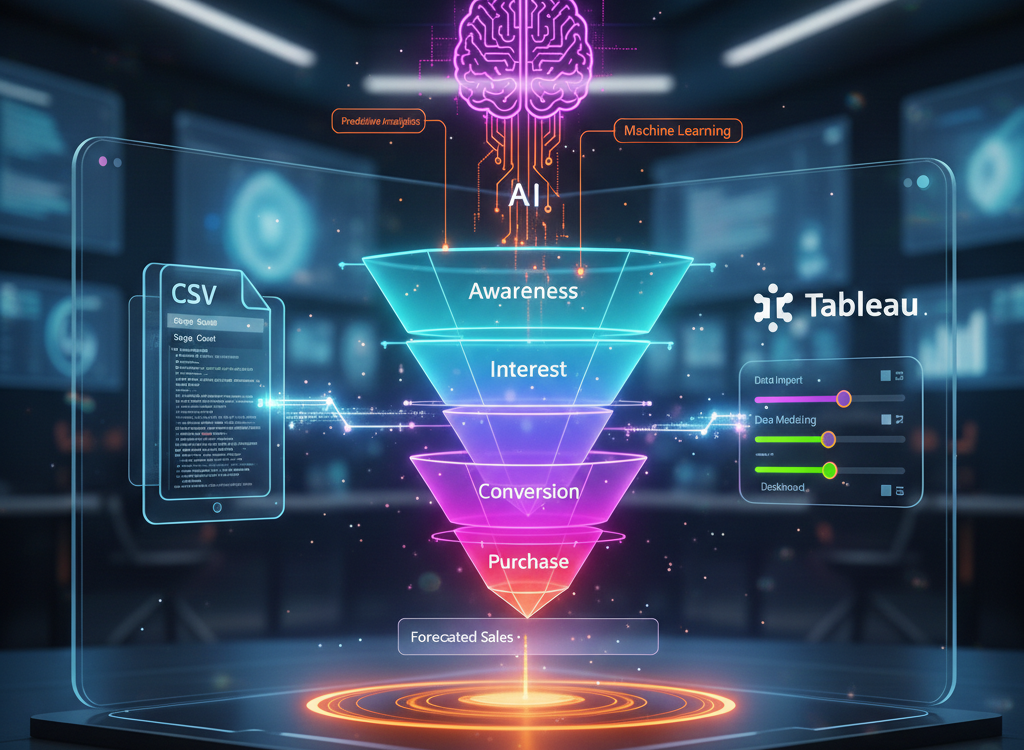
Why the Funnel Chart is the Most Important Tool in Your Arsenal
A funnel chart is a specialized type of visualization used to represent stages in a process. While it looks like a simple inverted pyramid, its utility in Data Analysis is profound. It tracks the “velocity” and “conversion” of users through a linear process.
Solving the User Pain Point: Where are the Leaks?
The primary desire of any business owner or analyst is to find where money is being lost. In a typical funnel, you might have:
- Awareness: Total visitors to a site.
- Interest: Users who clicked on a product.
- Desire: Users who added an item to a cart.
- Action: Users who completed the purchase.
The “pain point” occurs when there is a massive drop between “Desire” and “Action.” Without a proper Tableau funnel chart using CSV, identifying this gap involves hours of manual Data Processing. With a smart generator, these “leaks” are highlighted automatically through Analytics Automation
The Core Components: Tableau, CSV, and AI
To build a world-class generator, you need three pillars: a reliable data source, a powerful visualization engine, and an intelligent layer to interpret the results.
1. The CSV Document: The Universal Data Language
The CSV (Comma Separated Values) document remains the gold standard for data portability. Whether your data comes from a complex SQL database, a Shopify store, or a simple Google Sheet, it can almost always be exported as a CSV. Using a CSV document as your primary input for a Tableau funnel chart ensures that your system is flexible and can handle data from any source.
2. Tableau: The Visualization Powerhouse
Whether you are using Tableau Desktop for professional internal reporting or Tableau Public for sharing insights with the world, Tableau offers unparalleled depth in Data Storytelling. It allows for Data Modeling that can handle millions of rows without slowing down, ensuring your Dashboard remains responsive and helpful to the end-user.
3. AI and Machine Learning: The “Smart” Layer
Traditional charts are reactive they show you what is already gone. An AI data visualization approach is proactive. By integrating Machine Learning algorithms, your funnel chart can perform Predictive Analytics. It can look at three years of historical CSV data and tell you: “Based on current trends, you will likely fall 10% short of your sales goal next month unless you increase Awareness traffic today.”

Step-by-Step Guide: Building Your Smart Funnel Generator
Creating a high-quality funnel isn’t just about clicking buttons; it’s about proper Data Import and structure. Follow these steps to ensure your content is optimized and your chart is accurate.
Phase 1: Data Preparation and CSV Optimization
Before opening Tableau, your CSV must be structured correctly. A “human-written” approach to data means organizing it so it is readable. You need at least three columns:
- Stage Name: (e.g., Lead, MQL, SQL, Closed Won).
- Value/Count: The number of people in that stage.
- Order: A numerical value (1, 2, 3, 4) to ensure Tableau knows the sequence of the funnel.
Phase 2: Connecting to Tableau
Once your CSV document is ready, open Tableau.
- Connect to Data: Select “Text File” and choose your CSV.
- Data Modeling: Ensure that your “Order” column is treated as a dimension so you can sort the funnel stages correctly.
- Initial Visualization: Drag “Stage Name” to Rows and “Value” to Columns.
Phase 3: The “Mirrored” Funnel Technique
To get that classic funnel shape (symmetrical on both sides), you need a clever trick.
- Create a Calculated Field called “Negative Value” with the formula -[Value].
- Drag both “Value” and “Negative Value” to the Columns shelf.
- This creates a centered chart that looks professional and is easy for even a child to understand at a glance
Elevating Content with AI and Predictive Analytics
The transition from a standard chart to a Smart AI funnel chart generator happens when you utilize Tableau’s integration with R or Python, or its native “Explain Data” feature powered by AI (Artificial Intelligence).
Machine Learning Data Visualization
By applying Machine Learning to your funnel, you can automate the identification of anomalies. If the conversion rate between “Interest” and “Desire” drops by 20% overnight, the AI can trigger an alert. This Analytics Automation transforms the dashboard from a static image into a 24/7 business consultant.
Predictive Analytics for Future Growth
Imagine a predictive analytics funnel chart where the bottom of the funnel shows two bars: one for “Actual Sales” and a ghosted bar for “Projected Sales.” This allows managers to adjust their strategies in real-time. This is the pinnacle of Business Intelligence funnel charts.
Human-Centered Design: Making Data Accessible
A common mistake in Data Visualization is making things too complex. A “human-centered” funnel chart should be so clear that “every child can easily understand it.”

Tips for Better Readability:
- Color Psychology: Use warm colors (like orange) for the top of the funnel and cool, successful colors (like green) for the bottom.
- Clear Labeling: Don’t use jargon. Instead of “MQL,” use “Interested Visitors.”
- Interactive Elements: Let users click on a stage to see specifically who those people are. This makes the data feel real and personal.
The Future of AI Funnel Chart Generators
We are entering an era where Analytics Automation will handle the majority of the “grunt work.” In the near future, you won’t even need to build the chart.
You will simply upload your CSV document to an AI-powered Tableau interface and say, “Show me where my sales process is failing.”
The system will then perform the Data Import, Data Modeling, and Predictive Analytics instantly. This shift allows human creators to focus on Data Storytelling—the art of explaining why the numbers are moving and how to fix them.
Conclusion
Building a Smart AI funnel chart generator using Tableau and CSV document is the ultimate way to stay ahead in the world of Business Intelligence. By following the steps of clean Data Processing, leveraging Machine Learning, and focusing on a human-centered design, you turn raw numbers into a roadmap for success.
Whether you are a data scientist or a small business owner, these tools are now within your reach. Start with your CSV, trust the power of Tableau, and let AI guide your insights. This is the path to truly optimized, engaging, and effective business growth
FAQ
What is an AI funnel chart generator?
An AI funnel chart generator is a tool or workflow that uses Artificial Intelligence to organize and visualize the stages of a customer journey automatically. Unlike traditional charts, it uses Machine Learning to identify trends, highlight conversion drops, and provide Predictive Analytics to forecast future outcomes based on your historical data
Why should I use a CSV document for Tableau funnel charts?
A CSV document is a “universal” file format. Most business software (like Shopify, HubSpot, or Salesforce) allows you to export data as a CSV. Using this format makes Data Import into Tableau seamless, ensuring that you can build a funnel chart regardless of where your original data is stored
Do I need to be a programmer to use AI in Tableau?
No! Tableau Desktop and Tableau Public have built-in “Smart” features like “Explain Data” and “Ask Data” that use Artificial Intelligence to help you understand your metrics. While you can use Python or R for advanced Machine Learning, the native tools are designed to be user-friendly for everyone
How does a funnel chart improve Business Intelligence?
Business Intelligence (BI) is all about making better decisions. A funnel chart provides a clear visual of where your process is succeeding or failing. By seeing the “leakage” in your sales or marketing funnel, you can stop guessing and start making data-driven improvements to increase revenue
Can I create a funnel chart for free?
Yes! You can use Tableau Public, which is a free version of the software. By uploading your CSV document, you can create professional grade Data Visualizations and share them with your team or online community at no cost